Policy Memorandum
Subject: Identified Inconsistencies in USDA Income Eligibility Guidelines Based on Income Frequency Reporting
Reported to USDA, ISBE: October 25, 2019
Most recent update: June 6, 2025
Author: Slawomir Lisznianski, PushCoin
Overview
Analysis of the USDA Income Eligibility Guidelines for Free and Reduced-Price Meals (130% and 185% of the Federal Poverty Level) for the 48 contiguous states reveals systematic inconsistencies when comparing income thresholds across different pay frequencies (weekly, biweekly, monthly, twice per month, annually). These inconsistencies result in families with identical household sizes and annual incomes receiving different eligibility outcomes solely based on how their income is reported.
This memo outlines the largest detected discrepancies and illustrates them with fictitious family examples.
Summary of Key Findings
Weekly income allowance often exceeds annual cap
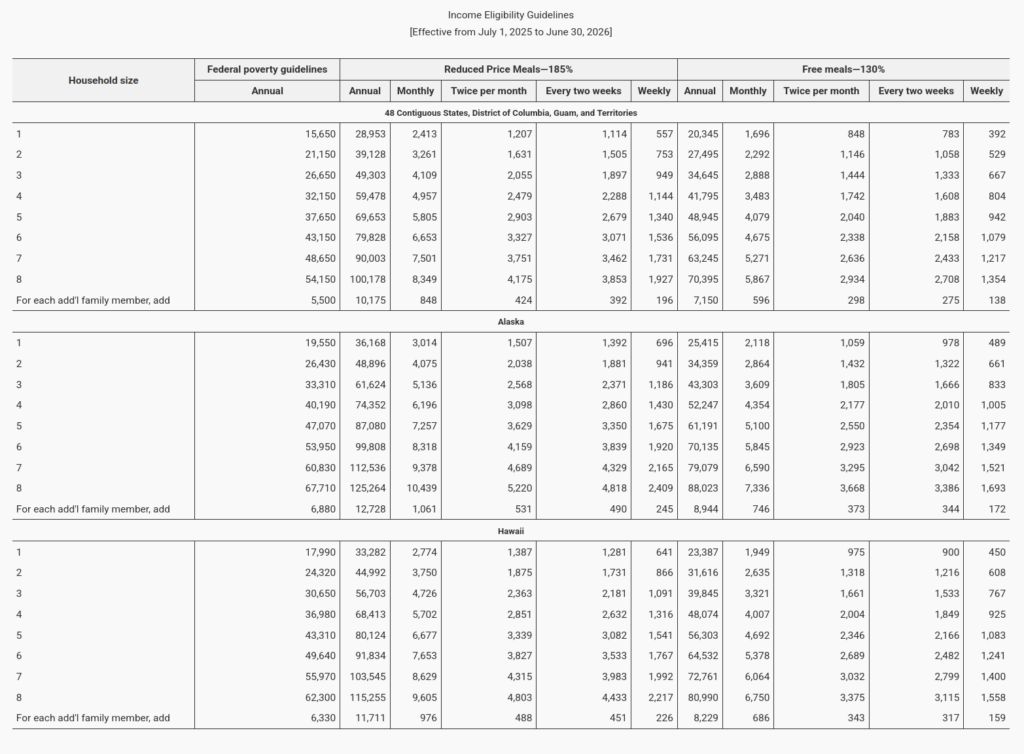
Household Size 5 (130% Free Meals)
- Annual threshold: $48,945
- Weekly threshold: $942
- Annualized weekly income: $942 × 52 = $48,984
Due to rounding and administrative cutoff, a family reporting $942/week (annualized $48,984) is approved under the weekly threshold, while a family reporting $48,950/year is denied — despite having a lower effective income.
Biweekly and Twice-Per-Month thresholds drift slightly
Household Size 5 (130% Free Meals)
- Biweekly threshold: $1,883
- Annualized Biweekly income: $1,883 × 26 = $48,958
- Twice-Per-Month threshold: $2,040
- Annualized Twice-Per-Month threshold: $2,040 × 24 = $48,960
- Annual threshold: $48,945
Families reporting Biweekly or Twice-Per-Month are treated similarly – within $2.00 – while those reporting Annually once again are more likely to be denied.
Relative gaps
Household Size 1 (130% Free Meals)
- Annual threshold: $20,345
- Weekly threshold computed from 52 pay periods: $20,345 / 52 = $391.25
- USDA rounded weekly threshold of $392/week, when annualized ($392 × 52 = $20,384) results in $39 over the annual cap
Per-period rounding variances allow families to qualify under frequency-based reporting, while lower annual reporters are denied.
Fictitious family examples
| Family A: household size 5 (Higher Weekly Income, Approved) | Family B: household size 5 (Lower Annual Income, Denied) |
| Reported income: $942/week Annualized income: $48,984 Eligibility result: Approved under weekly threshold | Reported income: $48,950/year Eligibility result: Denied under annual cap ($48,945) |
| Family C: household size 1 (Higher Weekly Income, Approved) | Family D: household size 1 (Lower Annual Income, Denied) |
| Reported income: $392/week Annualized income: $20,384 Eligibility result: Approved under weekly threshold | Reported income: $20,350/year Eligibility result: Denied under annual cap ($20,345) |
Source of the USDA errors
Through simple reverse engineering of the numbers in the USDA Income Eligibility Guidelines, we arrive at the formulas that USDA administrators use to compute eligibility guidelines for FREE and REDUCED families:
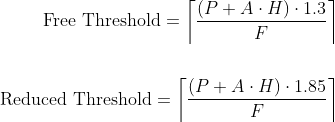
Where:
P = HHS poverty threshold (base amount)
A = per-household-member allowance
H = household size
F = pay frequency per year (12 for monthly, 26 for biweekly…)
⌈⌉ = ceiling function (rounds up to nearest whole number)
HHS poverty threshold: The U.S. federal poverty guidelines, as published by the U.S. Department of Health and Human Services (HHS), are used by various federal programs to determine eligibility. These guidelines are updated annually and are based on the U.S. Census Bureau’s poverty thresholds, adjusted for inflation using the Consumer Price Index.
The source of the error in the USDA published figures comes from rounding of the pay period threshold. When a rounded pay period threshold is multiplied by its pay frequency (52 times for weekly, 26 times for biweekly, 12 times for monthly, etc) to annualize the income, USDA is exceeding its household annual caps on the basis of the reporting periods alone. Logic dictates that if HSS publishes annualized caps, so should USDA and other agencies annualize their caps as well. Any rounding should occur once and after the final annualized amount is calculated. In other words, it shouldn’t matter if a family receives their income daily or once a year.
Recommendations
- Follow Formula 1 for all pay frequencies to calculate annualized income.
Formula 1
A = ⌊P × F⌋
Where:
A = Annualized income
P = Payment amount
F = payment frequency per year
⌊⌋ = floor function (rounds down to nearest whole number) - Publish annualized income thresholds for different family sizes. Educate administrators on using Formula 1 to calculate the annual income and comparing the result to the published thresholds for Free and Reduced status.
Example: family size 5
Payment amount: $941.50
Payment frequency: weekly (52 per year)
Annualized income: ceil ($941.50 × 52) = $48,958
Outcome: Not eligible for free, exceeds annual cap of $48,945 but eligible for Reduced-prices since below the annual cap of $69,653. - Implement Policy Clarifications ensuring families are assessed on equivalent annualized income, regardless of pay frequency.
- Communicate Guidance to local agencies to minimize administrative confusion and appeals from families on the eligibility margins.
References
About PushCoin
PushCoin is a school fees and point-of-sale system designed by parents and school business officials. The company was founded in Geneva, Illinois in early 2012 with the objective to provide an evolving, affordable and feature-rich cloud platform for schools. As the word got out, over the years PushCoin replaced cafeteria POS, web-store and school fees solutions including MySchoolBucks, MyMealtime, MealsPlus, Skyward, RevTrak, Sungard and FrontStream at the largest school districts in Illinois and Wisconsin.